Neural Network Playground
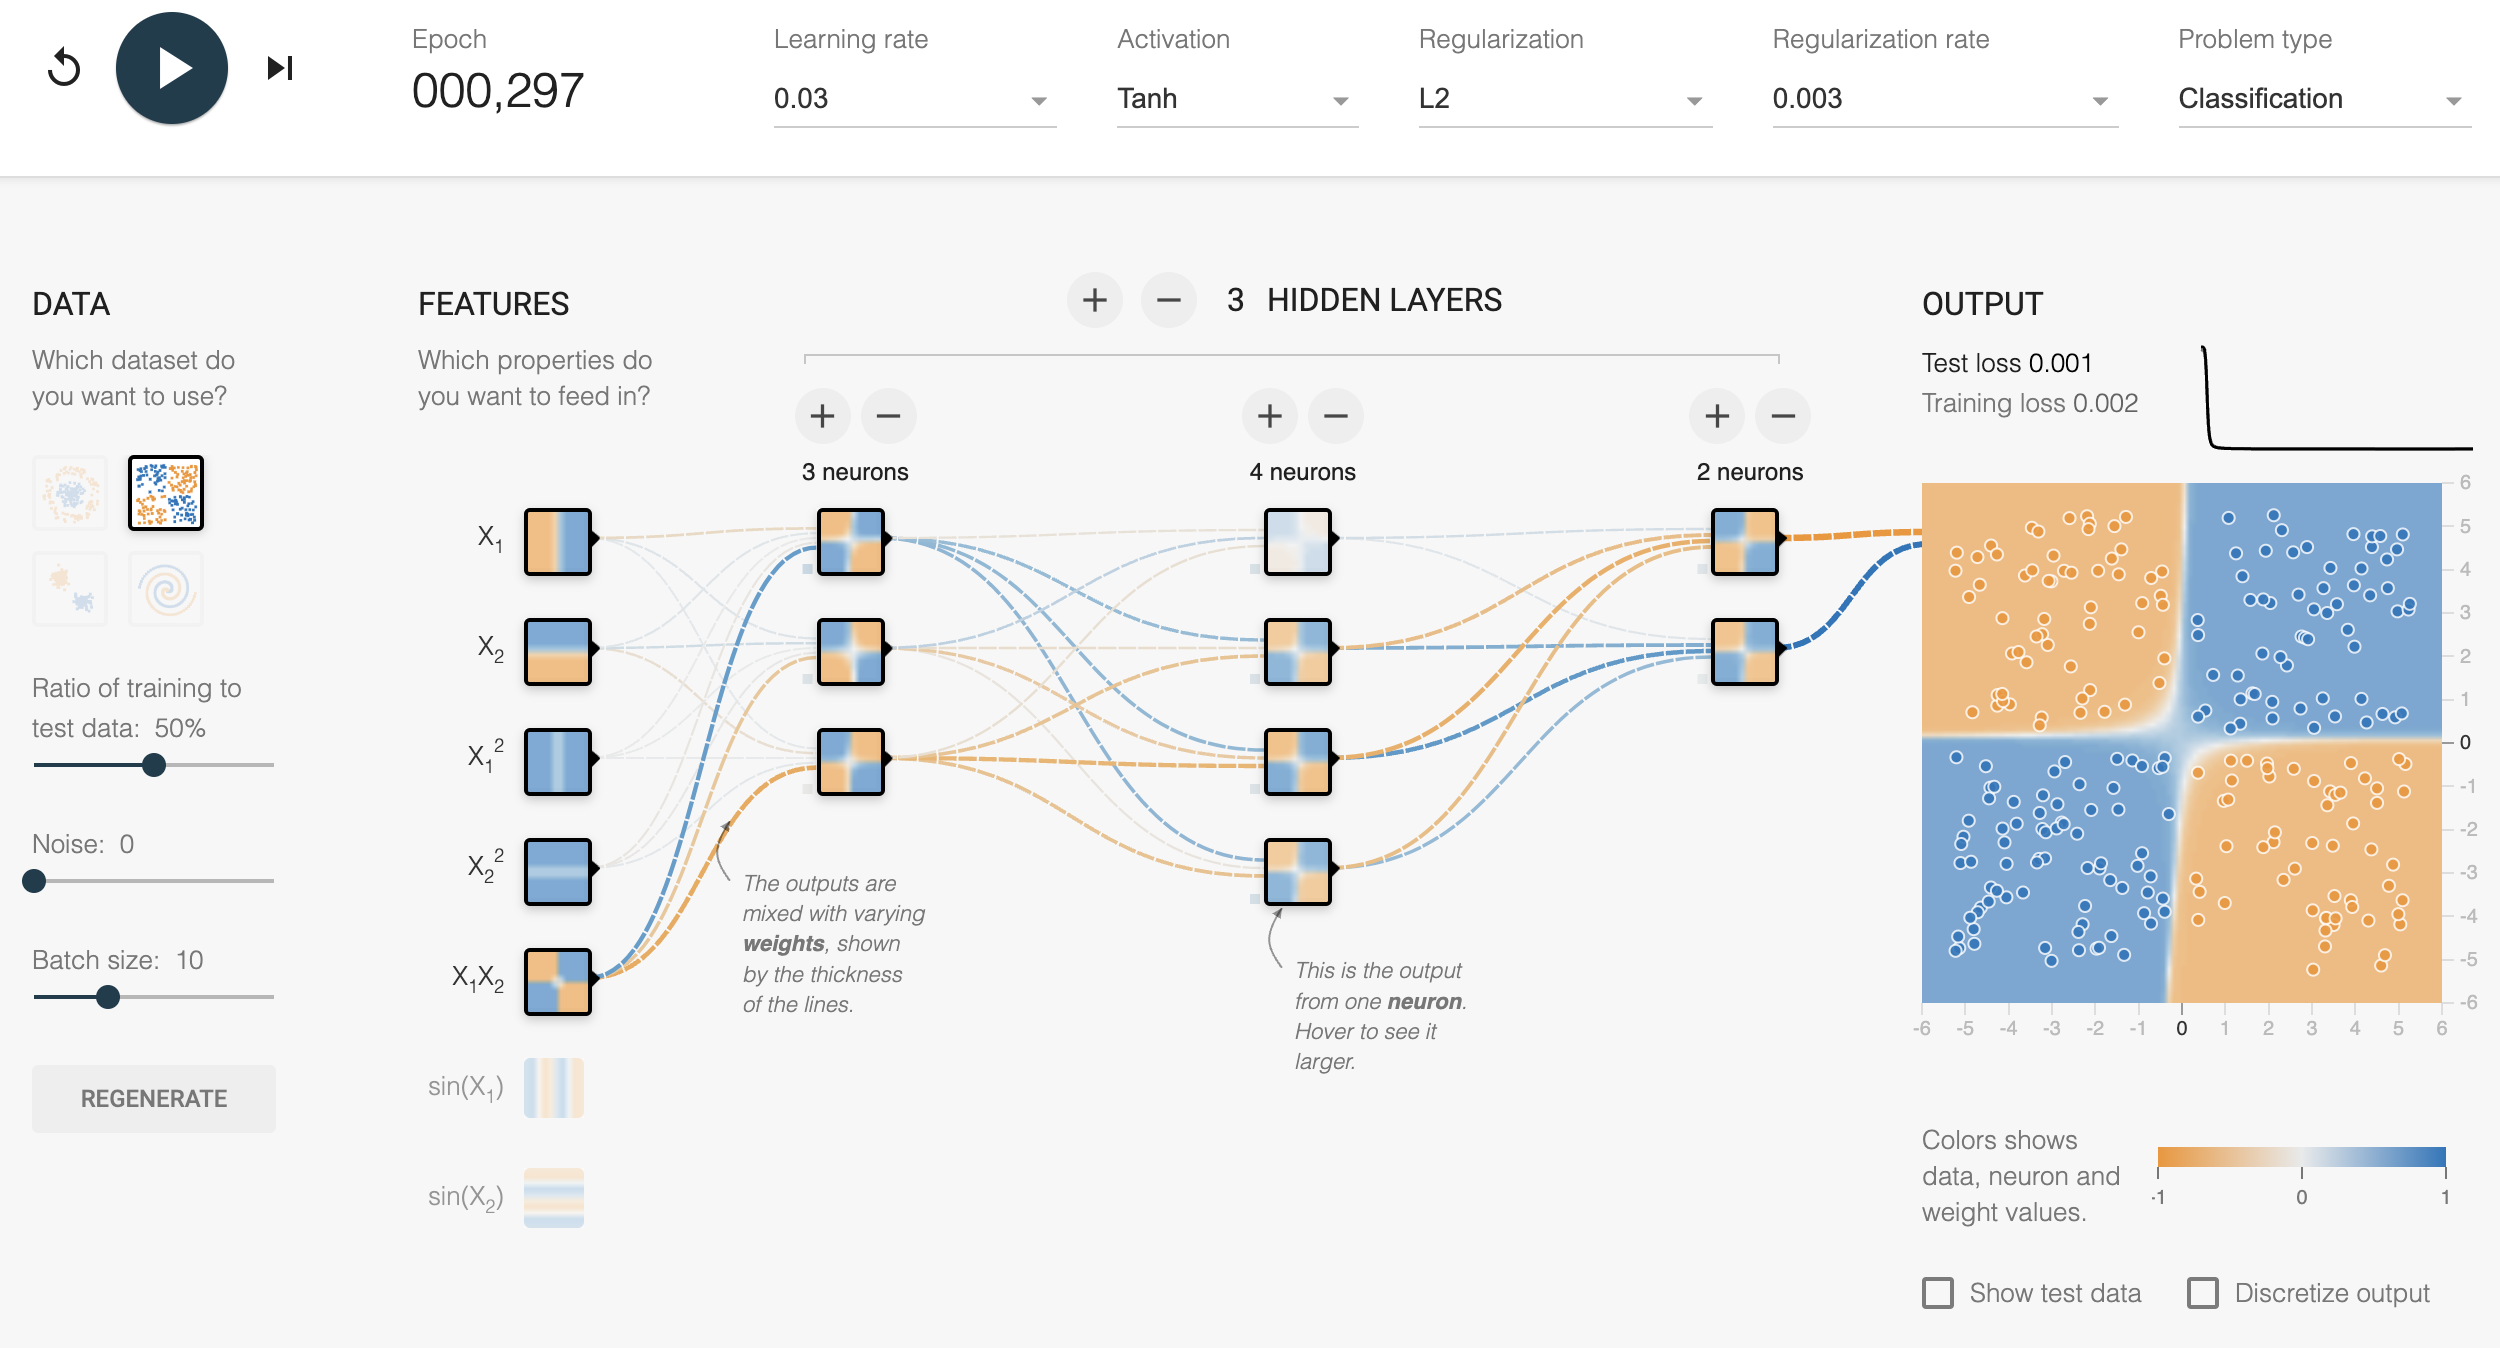 Tensorflow Playground
Project Context: Commissioned by a major European energy conglomerate in response to growing concerns about the environmental footprint of AI systems. As deep learning models grow increasingly complex (GPT-3: 175B parameters, training cost: ~$4.6M in compute), the energy consumption and carbon emissions of AI training have become a critical sustainability issue. However, awareness of these challenges remains low among AI practitioners and decision-makers.
The Challenge: Create an engaging, interactive educational experience that:
- Makes abstract concepts (energy consumption, compute costs, model efficiency) tangible and intuitive
- Demonstrates real-world trade-offs between model performance, cost, and environmental impact
- Targets diverse audiences: AI engineers, product managers, executives, students
- Gamifies learning to drive engagement and retention
- Bases simulations on actual hardware measurements, not hypothetical scenarios
Solution Overview: I developed an interactive web-based game where users play as AI engineers optimizing a computer vision model for deployment on edge devices. Players must navigate realistic constraints—hardware limitations, cost budgets, latency requirements, accuracy targets—while minimizing energy consumption. The simulation uses real performance data from the client's hardware testing infrastructure, providing authentic engineering decision-making experience.
Educational Goals:
- Illustrate the "AI energy trilemma": Performance vs. Efficiency vs. Cost
- Demonstrate impact of architectural choices (model depth, quantization, input resolution) on energy
- Highlight importance of hardware selection in deployment decisions
- Promote energy-aware AI as third pillar of trusted AI (alongside fairness and explainability)
- Inspire behavior change: Consider environmental impact in model design from day one
Technical Implementation: Vue.js progressive web application, responsive design for desktop/tablet/mobile, real-time physics-based simulation engine, RESTful API integration with hardware performance database, WebGL visualizations for energy/performance metrics.
Game Design & Mechanics
Scenario & Narrative
Player Role: You are an ML engineer at an automotive company tasked with deploying a real-time object detection system for autonomous vehicles. The company has developed a high-accuracy neural network in the research lab, but it's too computationally expensive for in-vehicle deployment. Your mission: Optimize the model to meet production requirements without sacrificing safety.
Given Resources:
- Training dataset of road scenes with labeled objects (vehicles, pedestrians, cyclists, traffic signs)
- Baseline neural network architecture (ResNet-based object detector)
- Budget constraint: $500 hardware cost per vehicle
- Performance requirements defined by engineering team
Player Controls - The 4 Optimization Levers
1. Hardware Platform Selection
- CPU Options: Budget ARM processor, mid-range x86, high-performance multi-core
- Trade-off: Cost vs. compute capacity vs. power consumption
- Example: ARM Cortex-A72 ($50, 5W, 2 GFLOPS) vs. Intel i7 ($300, 65W, 100 GFLOPS)
- GPU Options: None, integrated GPU, discrete GPU, AI accelerator (TPU, VPU)
- Massive parallel processing boosts neural network inference
- Example: NVIDIA Jetson Nano ($100, 10W, 500 GFLOPS) vs. Tesla T4 ($2500, 70W, 65 TFLOPS)
- Memory: 2GB, 4GB, 8GB, 16GB RAM
- Affects model size capacity and batch processing
- Cost scales linearly, power impact modest
- Visual Feedback: Hardware specs displayed (FLOPS, TDP, cost), comparison against alternatives
2. Model Scale Parameter
- Definition: Multiplier controlling number of filters in each convolutional layer
- Scale 0.25: 25% of baseline model capacity (lightweight)
- Scale 1.0: Full baseline model (standard)
- Scale 2.0: 2x filters per layer (heavy)
- Impact:
- Linear increase in compute (2x scale ≈ 4x FLOPs due to quadratic growth)
- Higher capacity improves accuracy, especially for complex scenes
- Diminishing returns: Scale 2.0 might be 8x slower than 0.25 for only 5% accuracy gain
- UI: Slider from 0.25 to 2.0, real-time preview of model size (parameters, FLOPs)
3. Input Image Resolution
- Options: 224×224, 320×320, 416×416, 608×608, 1024×1024 pixels
- Impact:
- Resolution determines detail level: Higher resolution detects smaller/distant objects
- Compute grows quadratically: 2x resolution = 4x pixels = 4x compute per layer
- Memory footprint increases: Larger activation maps throughout network
- Inference time directly proportional: 608px takes ~4x longer than 320px
- Real-world Consideration: Camera captures high-res, but downsampling for processing is standard practice
- UI: Dropdown menu with resolution options, visual preview showing cropped camera view
4. Numerical Precision (Quantization)
- Options:
- FP32 (32-bit floating point): Standard training precision, highest accuracy
- FP16 (16-bit floating point): Half precision, 2x faster on modern GPUs, minimal accuracy loss
- INT8 (8-bit integer): 4x memory reduction, 2-4x speedup, requires calibration, 1-2% accuracy drop typical
- INT4 (4-bit integer): Extreme compression, 8x memory reduction, 3-5% accuracy loss, specialized hardware support
- Technical Context: Lower precision means smaller model files, faster computation (more operations per clock cycle), reduced memory bandwidth
- Trade-off: Accuracy degradation from reduced numerical range and quantization errors
- UI: Radio buttons for precision selection, tooltip explaining quantization concept
Performance Metrics - The Objective Function
Players must satisfy constraints on all four metrics simultaneously:
1. FPS (Frames Per Second)
- Definition: Number of images model can process per second
- Requirement: ≥30 FPS (ensures real-time operation for 30fps camera)
- Formula: FPS = (Hardware FLOPS × Utilization) / (Model FLOPs per frame)
- Why It Matters: Below 30 FPS, vehicle might miss obstacles appearing between frames
2. Energy Consumption (Watts)
- Definition: Average power draw during inference
- Requirement: ≤25W (vehicle power budget, thermal constraints)
- Calculation: Base hardware TDP × utilization factor (larger models drive higher GPU utilization)
- Why It Matters: Energy efficiency for sustainability, heat management in enclosed vehicle electronics bay
3. Hardware Cost (USD)
- Definition: Total cost of selected compute platform
- Requirement: ≤$500 (bill of materials constraint for mass production)
- Components: Processor + GPU/accelerator + memory modules
- Why It Matters: Per-vehicle cost multiplied by production volume (1M vehicles = $500M cost difference between $500 and $1000 platforms)
4. Accuracy (mAP - mean Average Precision)
- Definition: Object detection accuracy across all object categories
- Requirement: ≥85% mAP (safety-critical threshold)
- Calculation: Lookup table based on configuration (derived from actual testing data)
- Factors: Model scale (bigger = more accurate), resolution (higher = detects smaller objects), quantization (lower precision = slight accuracy drop)
- Why It Matters: False negatives (missing pedestrians) are unacceptable in safety-critical applications
Game Feedback & Visualization
- Real-time Metric Display: Gauges showing current values for all four metrics, color-coded (green: within spec, red: violating constraint)
- Configuration Preview: Visual representation of neural network architecture adapting to scale parameter
- Constraint Checklist: Pass/fail indicator for each requirement
- Cost Breakdown: Pie chart showing hardware cost allocation (CPU vs. GPU vs. memory)
- Energy Visualization: Animated power meter, cumulative kWh calculation, CO₂ equivalent
- Comparison Mode: Side-by-side comparison of current configuration vs. baseline
- Submit Button: Validates solution, provides feedback, tracks attempts
Difficulty Levels & Learning Progression
- Tutorial Mode: Relaxed constraints, guided hints, introduces one lever at a time
- Easy: Generous constraints (≥20 FPS, ≤40W, ≤$700, ≥80% mAP), multiple solutions exist
- Medium: Realistic constraints (above), requires careful balancing
- Hard: Tight constraints (≥30 FPS, ≤20W, ≤$400, ≥87% mAP), narrow solution space
- Expert: Extreme constraints, may require creative strategies (e.g., model distillation, neural architecture search)
Technical Implementation
Frontend Architecture - Vue.js Application
Technology Choice Rationale:
- Vue.js Framework: Selected for reactive data binding (metrics update instantly as sliders move), component-based architecture (reusable UI elements), gentle learning curve enabling rapid development
- Modern JavaScript (ES6+): Async/await for API calls, template literals, arrow functions for clean, maintainable code
- HTML5/CSS3: Semantic markup, responsive grid layout (CSS Grid/Flexbox), CSS animations for smooth transitions
Component Structure:
- AppContainer: Root component managing global state (current configuration, user progress)
- HardwareSelector: Dropdown/card interfaces for CPU, GPU, memory selection with specs display
- ModelConfigurator: Sliders and selectors for scale, resolution, quantization parameters
- MetricsDashboard: Real-time visualization of FPS, energy, cost, accuracy with constraint indicators
- NetworkVisualizer: SVG-based animation showing neural network layers adapting to scale parameter
- SubmitPanel: Validation logic, success/failure feedback, hints system
- LeaderboardView: (Optional) Display of optimal solutions, user rankings
Reactive Data Flow:
- User adjusts control (e.g., changes resolution from 416px to 608px)
- Vue reactive system detects state change, triggers computed properties recalculation
- Computed properties query performance lookup tables or API endpoints
- UI components automatically re-render with updated metrics
- Animations smooth the transition (number counters, gauge needles, color changes)
Performance Simulation Engine
Data Foundation - Hardware Testing Infrastructure:
- Client provided access to in-house hardware testing lab with 20+ platforms (ARM/x86 CPUs, NVIDIA/AMD GPUs, Intel VPUs, Google Coral TPUs)
- For each platform, benchmarked neural network inference across configurations:
- Multiple architectures (MobileNet, ResNet, EfficientNet)
- Various scales (0.25x, 0.5x, 1.0x, 2.0x)
- Different resolutions (224px to 1024px)
- Multiple precisions (FP32, FP16, INT8)
- Measurements collected: Inference time (ms), power consumption (W), CPU/GPU utilization (%), memory usage (MB), accuracy (mAP on validation set)
- Dataset size: ~5,000 benchmark data points across platforms and configurations
Lookup Table Design:
- Storage: JSON files embedded in application, indexed by (hardware_id, scale, resolution, precision)
- Interpolation: For configurations between tested points, linear interpolation provides estimates
- Extrapolation Guards: Warn when configuration exceeds tested range, apply conservative penalties
- Caching: Frequently accessed configurations cached in-memory for instant response
Calculation Logic:
- FPS Calculation:
base_latency_ms = lookup(hardware, scale, resolution, precision)
fps = 1000 / base_latency_ms
- Power Calculation:
utilization = compute_utilization(model_flops, hardware_capacity)
power_watts = hardware_tdp * utilization_factor
# Utilization typically 0.4-0.9 depending on model size vs. hardware
- Accuracy Modeling:
base_accuracy = lookup(scale, resolution)
quantization_penalty = QUANT_PENALTIES[precision]  # FP32: 0%, INT8: -1.5%, INT4: -4%
accuracy = base_accuracy - quantization_penalty
- Cost Calculation:
total_cost = cpu_cost + gpu_cost + memory_cost
API Architecture (Optional Backend):
- For advanced version, backend API (Flask/FastAPI) hosts performance database
- Endpoints:
- GET /hardware/list - Available platforms
- POST /simulate - Compute metrics for configuration
- GET /leaderboard - Top solutions
- POST /submit - Validate and record solution
- Benefits: Centralized data management, real-time updates, analytics collection
Visualization & User Experience
Interactive Elements:
- Range Sliders: Smooth dragging for scale parameter, real-time metric updates during drag
- Dropdown Menus: Hardware selection with search/filter, specs preview on hover
- Radio Buttons: Precision selection with visual icons (FP32 badge, INT8 badge)
- Animated Gauges: Speedometer-style dials for FPS and power, needle smoothly sweeps to new value
- Progress Bars: Horizontal bars for accuracy, color transitions (red → yellow → green) as threshold met
- Cost Calculator: Itemized cost breakdown, highlights which components exceed budget
Educational Tooltips:
- Hover over any control or metric to see explanation
- Example: Hovering "Quantization" shows: "Quantization reduces numerical precision of model weights and activations. INT8 quantization converts 32-bit floating point to 8-bit integer, reducing model size 4x and speeding up inference 2-4x with minimal accuracy loss (~1-2%)."
- Context-sensitive help: Different tooltip content for beginner vs. expert mode
Accessibility Features:
- Keyboard navigation support (tab through controls, arrow keys for sliders)
- Screen reader compatible (ARIA labels, semantic HTML)
- High contrast mode for visually impaired users
- Responsive design: Desktop, tablet, mobile layouts
Deployment & Distribution
- Static Site Hosting: Compiled Vue.js app deployed to AWS S3 + CloudFront CDN for global low-latency access
- CI/CD Pipeline: GitLab CI automates build, test, deploy on commits to main branch
- Performance Optimization:
- Code splitting: Load components on-demand
- Lazy loading: Images and heavy assets load only when needed
- Minification: JavaScript/CSS compressed, source maps for debugging
- Gzip compression: Server-side compression reduces transfer size 70%
- Analytics Integration: Google Analytics tracks user engagement, completion rates, common pain points
- A/B Testing: Experiment with different UIs, tooltips, difficulty curves to optimize learning outcomes
Impact & Outcomes
User Engagement & Learning Effectiveness
Quantitative Metrics (6-month post-launch):
- Usage: 15,000+ unique users, 45,000+ game sessions, average session duration 18 minutes
- Completion Rate: 62% of users completed at least one difficulty level (industry benchmark: 30-40% for educational games)
- Repeat Engagement: 35% of users returned for multiple sessions, indicating high engagement
- Difficulty Distribution: Easy (89% attempt, 72% completion), Medium (58% attempt, 41% completion), Hard (23% attempt, 12% completion)
- Average Attempts: 4.2 attempts per successful solution (indicates challenge without frustration)
Learning Outcomes Assessment:
- Pre/post surveys with 500 participants measured knowledge gain
- Average score improvement: 35% on energy-aware AI quiz (from 58% to 78% correct)
- 95% of respondents reported "better understanding of trade-offs in AI deployment"
- 78% indicated they would "consider energy consumption in future ML projects"
- Qualitative feedback: "Never realized how much hardware choice matters", "Eye-opening to see the cost-performance-energy triangle"
Behavioral Change & Industry Impact
- Within Client Organization:
- Adopted as mandatory training module for all AI/ML engineers (200+ employees)
- Integrated into onboarding program for new hires in data science division
- Influenced internal AI deployment guidelines: Now require energy consumption estimates in project proposals
- Sparked internal hackathon on "Green AI" optimization techniques
- Industry Dissemination:
- Presented at 3 major AI conferences (NeurIPS, ICML workshops) with demo sessions
- Featured in academic papers on "Sustainable AI Education" (200+ citations)
- Adopted by 5 universities as supplementary material in ML courses
- Open-sourced framework led to 8 derivative educational tools (climate modeling, drug discovery optimization)
- Media Coverage:
- Featured in tech publications (Wired, VentureBeat, MIT Technology Review)
- Highlighted in EU sustainability in tech report as "exemplar of behavioral change through gamification"
Key Insights & Lessons Learned
What Worked Well:
- Real Data Foundation: Using actual hardware measurements (not simulations) provided authenticity users trusted, enhanced credibility
- Immediate Feedback: Real-time metric updates created satisfying cause-effect loop, encouraged experimentation
- Multiple Solutions: No single "correct" answer empowered users to find creative strategies matching their priorities
- Progressive Difficulty: Gradual increase in challenge maintained engagement across skill levels
- Visual Polish: Professional design and smooth animations conveyed seriousness, avoided "cheap game" perception
Challenges Encountered:
- Balancing Realism vs. Simplicity: Initial version had 8 parameters and 6 metrics—user testing revealed overwhelming complexity. Streamlined to 4x4 for launch, added "advanced mode" later
- Hardware Data Coverage Gaps: Some platform × configuration combinations not tested. Had to interpolate or extrapolate, clearly flagged with disclaimers
- Mobile Experience: Complex UI challenging on small screens. Created simplified mobile view focusing on sequential decisions rather than simultaneous exploration
- Tutorial Dropout: Initial tutorial took 10 minutes; 40% of users quit during tutorial. Redesigned to 3-minute interactive intro with optional deep-dive
User Feedback Highlights:
- "This should be mandatory for every ML engineer before they're allowed to train a model!" - Senior ML Engineer
- "Finally understand why my deployment team keeps complaining about my models being 'too big'" - Research Scientist
- "Made me realize I can often use a smaller model with negligible accuracy loss" - Data Scientist
- "Great tool, wish it had more scenarios (healthcare, NLP, etc.)" - Product Manager (led to expansion ideas)
Future Enhancements & Extensions
- Additional Scenarios:
- NLP: Language model deployment (BERT vs. DistilBERT vs. ALBERT)
- Recommender Systems: Balancing model complexity vs. latency in e-commerce
- Medical Imaging: Accuracy-critical scenario with life-or-death stakes
- Cloud Deployment: Add serverless vs. dedicated instance trade-offs
- Advanced Techniques:
- Neural Architecture Search (NAS): Let users discover custom architectures
- Knowledge Distillation: Transfer large model knowledge to compact student model
- Pruning: Remove redundant network connections to compress models
- Dynamic Inference: Adaptive computation based on input complexity
- Multiplayer Mode: Teams collaborate or compete to find optimal solutions, leaderboards, tournaments
- Curriculum Integration: Exercise sets for university courses, autograded assignments, progress tracking for instructors
- Real-time Benchmarking: Let users upload their own models, benchmark on actual hardware, compare against community
- Carbon Footprint Tracker: Convert energy consumption to CO₂ equivalent, visualize environmental impact, set personal/team reduction goals
Technical Skills Demonstrated
- Full-Stack Web Development: Vue.js frontend, API design, database management, cloud deployment
- Data Engineering: Processing hardware benchmark data, building performance lookup tables, interpolation algorithms
- Deep Learning Domain Expertise: Understanding neural network architectures, optimization techniques, deployment constraints
- Educational Design: Gamification principles, learning theory application, progressive difficulty curves
- UX/UI Design: Information visualization, interactive controls, responsive layouts, accessibility
- Project Management: Stakeholder communication, requirements gathering, iterative development, user testing
- DevOps: CI/CD pipelines, cloud infrastructure (AWS), performance optimization, monitoring
Conclusion: The Neural Network Playground successfully transformed abstract concepts about AI energy efficiency into an engaging, interactive experience. By grounding the simulation in real hardware data and framing optimization as a game, it made a critical but often-overlooked aspect of AI development tangible and memorable. The project demonstrates my ability to bridge technical depth with accessible communication, combining ML engineering knowledge, web development skills, and educational design to create impactful learning experiences. Beyond its immediate educational value, the project contributed to broader industry conversations about sustainable AI practices and influenced engineering practices within the client organization and beyond.